

 Rebecca Freeman
Imposition Software: Automate Layout, Cut Waste
 Rebecca Freeman : Jul 22, 2026, 11:44:38 AM
Learn how automated imposition software cuts paper waste, speeds prepress, and replaces manual layout templates for print and packaging production.

You quote a job, run it, ship it, and the margin comes in lower than the estimate promised. Nobody can say exactly why.
More often than not, the gap is waste. Makeready sheets that never got counted properly. Trim area the estimate ignored. A rerun after a late file change. Each loss looks small on its own. Together, they're one of the biggest controllable costs in a print operation, and most shops can't tell you what it was on a specific job.
The pressure is growing, too. Runs keep getting shorter, paper, ink, and reprint costs keep squeezing margins, and short runs are exactly where waste does the most damage.
Our guide shows you how to calculate makeready and substrate waste per job, step by step. You'll get a definition, a formula, a worked example with the arithmetic shown, realistic benchmarks, and the upstream fixes that move the number - plus a handy calculator that you can use!
Makeready waste is the substrate consumed while setting up a press or finishing machine until output is salable. Substrate waste is the broader total: makeready, running spoilage, finishing losses, and unused trim area. Calculated per job, it's the substrate you consumed minus the substrate that ended up in the finished product.
Planned waste is the allowance you build into an estimate. Spoilage is the unplanned part: defects, reruns, and excessive makeready or run losses. PRINTING United Alliance uses that definition and notes that no formal industry standards exist for spoilage. That's why your own measured numbers matter more than anyone's rule of thumb.
Start with the total sheets a job consumes:
Total sheets consumed (S) = G + M + R + F
Then express waste as a share of everything consumed:
Waste rate = (M + R + F) ÷ S × 100
Here's what each term means:
The same structure shows up in research. A 2014 BioResources study describes the standard estimate as a function of color count, print quantity, makeready waste, and press-run waste percentage. Its authors argue that approach overestimates waste, especially on presses with five or more units, and built a data-driven alternative from 120 commercial jobs.
To get your allowances, sample 10 to 20 typical jobs per press. Record sheets loaded, sheets at makeready sign-off, sheets delivered to finishing, and timestamps. Then split the data by press, color count, substrate, and run length.
Say you're printing 10,000 flyers, 8.5 x 11 inches, 4/4, four-up on a 20 x 26 inch sheet. The allowances below are illustrative, so swap in your own.
|
Component |
Calculation |
Sheets |
|---|---|---|
|
Good sheets (G) |
10,000 ÷ 4 ups |
2,500 |
|
Makeready (M) |
4 colors × 50 sheets × 2 sides |
400 |
|
Running waste (R) |
3% × 2,500 × 2 sides |
150 |
|
Finishing (F) |
Cutting and folding setup |
150 |
|
Total consumed |
2,500 + 400 + 150 + 150 |
3,200 |
|
Total waste |
400 + 150 + 150 |
700 |
The waste rate is 700 ÷ 3,200, or 21.9% of sheets consumed. Measured against good sheets, the same job shows 700 ÷ 2,500, or 28%. Both are correct. They just answer different questions.
Now the cost. At an illustrative $0.12 per sheet, the 700 wasted sheets cost $84. But makeready also took two setups of about 25 minutes each. At $450 per press hour, that's $375 of press time. On this job, makeready time costs more than four times the paper wasted on the entire job.
Makeready accounts for 57% of the wasted sheets (400 of 700). Because it's fixed, run length changes the percentage dramatically. Here are the same assumptions at three quantities:
|
Good sheets |
Total waste (sheets) |
Waste rate (of consumed) |
|---|---|---|
|
500 |
580 |
53.7% |
|
2,500 |
700 |
21.9% |
|
10,000 |
1,150 |
10.3% |
Industry benchmarks follow the same curve. A PIWorld article on pressroom productivity reported median planned waste near 240 percent for six-color jobs under 500 impressions, versus 1.5 percent for two-color jobs over 10,000 impressions. Numbers like that only mean something once you know what they're measured against, which is why the denominator matters.
Enter your job details to see waste per job. The starting values match the worked example above, so replace them with your own measured numbers.
| Component | Sheets |
|---|---|
| Good sheets (G) | - |
| Makeready (M) | - |
| Running waste (R) | - |
| Finishing (F) | - |
| Total sheets consumed | - |
| Total waste sheets (M + R + F) | - |
| Cost | Amount |
|---|---|
| Wasted substrate | - |
| Makeready press time | - |
| Total waste cost | - |
Estimates only. Yield ignores bleed, grip and color bars, and finishing waste is entered as a flat allowance. Use your own measured allowances for real jobs.
Want to run your own numbers? Enter your job details in the calculator above. It uses the same formula as the example above, so the starting values reproduce the 700 wasted sheets and the 21.9% waste rate. Replace them with your own measured allowances to see what a real job costs you.
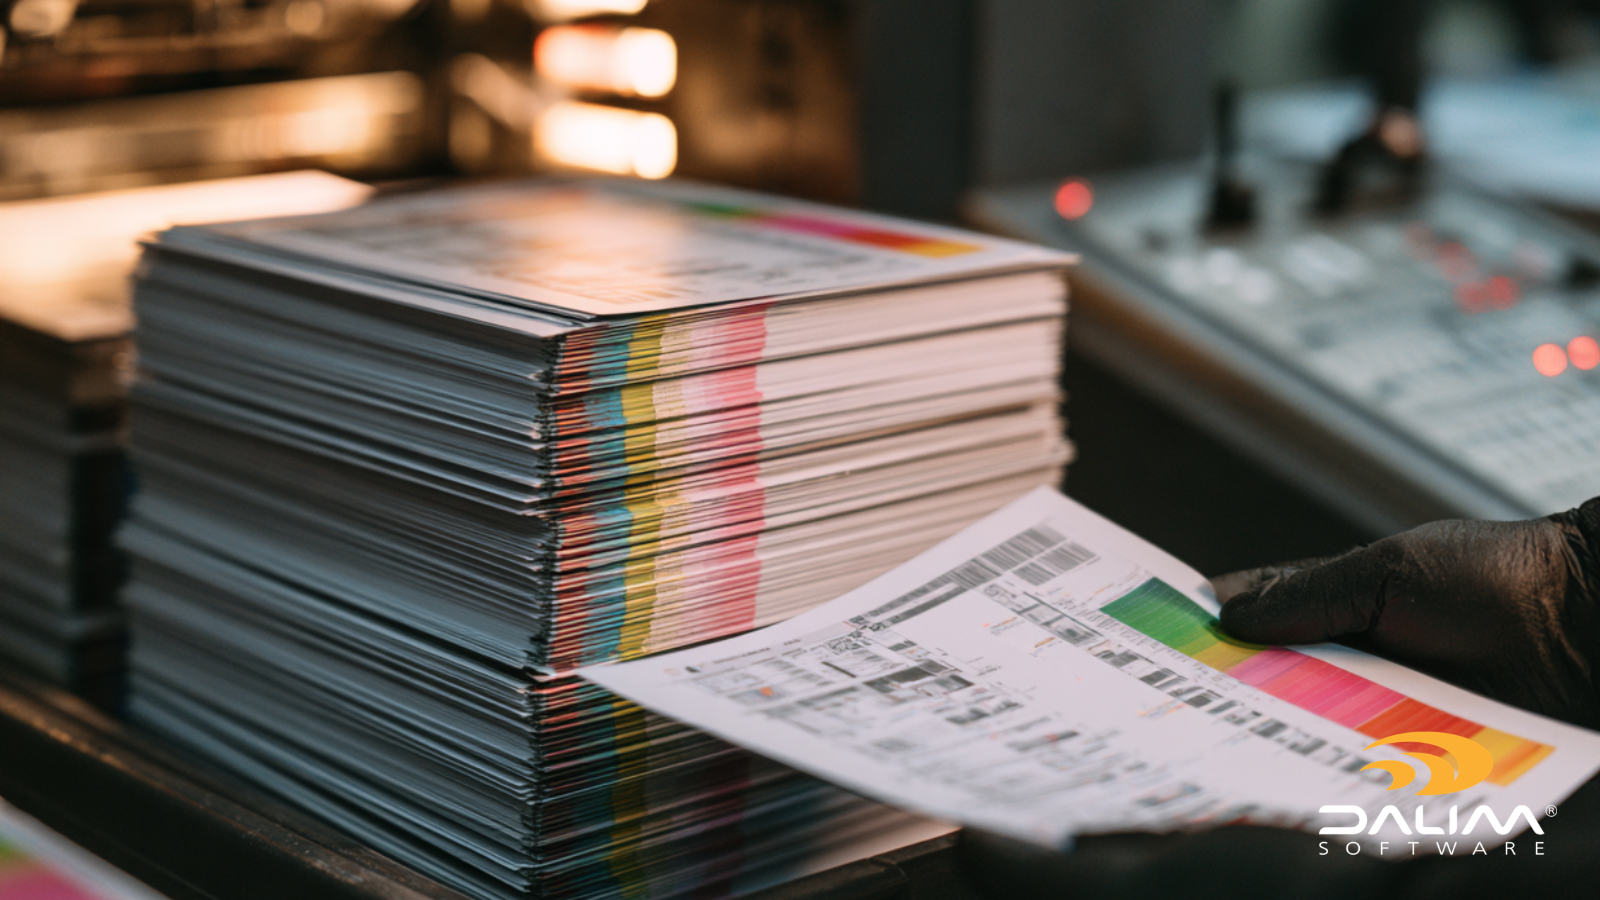
Makeready and spoilage aren't the only losses. Layout creates waste too. Four 8.5 x 11 flyers use 374 square inches of a 520 square inch sheet, so utilization is 71.9% before a single sheet is spoiled.
Combine both effects. The finished flyers cover 10,000 × 93.5 = 935,000 square inches. The job consumed 3,200 sheets × 520 = 1,664,000 square inches. Yield is 56.2%. Only about 56 percent of the substrate you bought ended up in the product (ignoring bleed, grip, and color bars to keep the math visible).
For roll-fed and packaging work, measure in linear meters or feet instead. Add setup length, length lost at each roll change, running waste, and conversion loss such as die-cutting. Then convert to area using web width. A 2023 TAGA paper on heat-shrinkable label production found that each roll change took 50 to 200 line meters to reach good print quality, so roll count belongs in your estimate.
There isn't one answer. PRINTING United Alliance reports that leading companies keep spoilage below 1% of sales, while planned allowances vary widely by press, color count, and run length, as the figures above show. Use outside numbers as a sanity check. Then set targets from your own baseline, by press and run-length band.
Makeready doesn't only depend on the press. A missing font, a low-resolution image, or a wrong color profile found at the press can mean stopped setups, remade plates, or a rerun. A late change that skips approval can mean a full reprint. Those losses get booked as press spoilage, but they start in prepress.
That's where workflow technology belongs in a waste conversation. DALIM FUSION's file checking and transformation runs rules-based preflight and can automatically correct common faults, such as missing fonts, low-resolution images, and color profile errors, before a file reaches production. Its online proofing and approval tools include version control and audit trails, which helps make sure the approved file is the one that gets printed. That traceability matters in packaging too, where a rerun can cost substrate and launch dates.
On the measurement side, DALIM FUSION's digital print capabilities include reporting on throughput, rejects, makeready time, and yield. Those are the same inputs the calculation above needs.
|
Common mistake |
Best practice |
|---|---|
|
Using one flat waste percentage for every job |
Set allowances by press, color count, and run-length band |
|
Mixing denominators between reports |
Pick one and label it on every report |
|
Counting only press waste |
Include finishing, trim, and reruns |
|
Ignoring makeready time |
Cost the minutes at your hourly press rate |
|
Padding estimates "just in case" |
Compare actuals with allowances every month |
|
Treating reruns as bad luck |
Log the cause: file, color, approval, or press |

Calculating makeready and substrate waste per job isn't complicated. Build the total from good sheets, makeready, running waste, and finishing. Add trim loss, state your denominator, and cost both the paper and the press time.
The hard part is discipline. Measure real jobs, split the data by press and run length, and log why reruns happen. Once you have that baseline, the biggest wins often sit upstream, in file quality and approvals.
If you'd like to see how file prep, approvals, and production reporting could fit around your own waste numbers, talk to the DALIM team about your workflow.
Makeready waste is the substrate used to set up a press or finishing machine until it produces salable output. It covers sheets spent on registration, color adjustment, and test runs. It's mostly fixed per job, so it hurts short runs the most.
Divide waste sheets by total sheets consumed, then multiply by 100. Waste sheets are makeready plus running waste plus finishing waste. Some shops divide by good sheets instead, which gives a higher percentage. Choose one denominator and label it in every report.
There's no universal number. One industry formula assumes 500 waste sheets per four-color setup, but research suggests that's pessimistic. Sample 10 to 20 of your own jobs per press, then set allowances by color count and run length.
It depends on run length, color count, and process. Long two-color runs can sit near 1.5 percent planned waste, while very short multicolor runs can run far higher. For spoilage, leading companies keep it below 1% of sales. Compare yourself within the same run-length band.
Planned waste is the allowance in your estimate. Spoilage is unplanned: defects, reruns, and excessive makeready or run waste. Tracking them separately shows whether you have an estimating problem or a process problem.
Measure in length. Add setup length, roll-change losses, running waste, and conversion loss such as die-cutting. Multiply by web width to get area, then compare it with the area of finished product to get yield.
Standardize setups and color targets, prepare work while the press runs, gang compatible jobs, and fix file and approval problems before they reach the press. Preflight automation and governed approvals address those upstream causes.
Add makeready, running, and finishing waste to the good sheet count. Then price the total sheets plus press time for makeready. Update your allowances regularly from actuals, not from memory.
 Rebecca Freeman : Jul 22, 2026, 11:44:38 AM
Learn how automated imposition software cuts paper waste, speeds prepress, and replaces manual layout templates for print and packaging production.
 Rebecca Freeman : Nov 16, 2026, 11:12:56 AM
Learn how multi-lane imposition and lane optimization work for labels and narrow-web, with a worked example, a planning framework and common mistakes.
 Rebecca Freeman : May 6, 2026, 10:56:39 AM
Discover the prepress automation techniques saving print teams hours every week. From preflighting to approvals, here's how to streamline production!